
What Local Advertising Really Looks Like in Your City
If you’re running ads, you’re already inside the market.
What most businesses never see is how that market actually behaves around them.
This page is about visibility — not tactics, not advice, and not selling anything.
Built from live Google Ads and search results data. Updated hourly. No uploads required. No obligation. No pitch.
Why Advertising Feels Unpredictable
Most business owners don’t experience advertising as steady or repeatable.
They experience it as:
Costs and lead flow fluxuate.
Competition seems to come and go.
Results shifting without a clear reason
That uncertainty is frustrating — especially when you’re already spending money and doing “the right things.”
What’s rarely clear is whether those swings are coming from your ads, or from the market around you.
The Local Blind Spot
Here’s the part most advertisers never actually see:
Advertising pressure isn’t evenly distributed.
Industry benchmarks, platform reports, and averages smooth everything out — but real competition happens locally, unevenly, and at specific moments.
In practice:
Different cities behave very differently
Competitors appear and disappear
Pressure concentrates around certain searches and times
What looks “normal” at an industry level can feel very different on the ground
If you’ve never looked at your market from the outside — beyond your own account — you’re filling in those gaps with assumptions.
What A Local Market View Reveals
A city-level market view doesn’t evaluate your campaigns or tell you what to do.
It simply shows what’s happening around you, including:
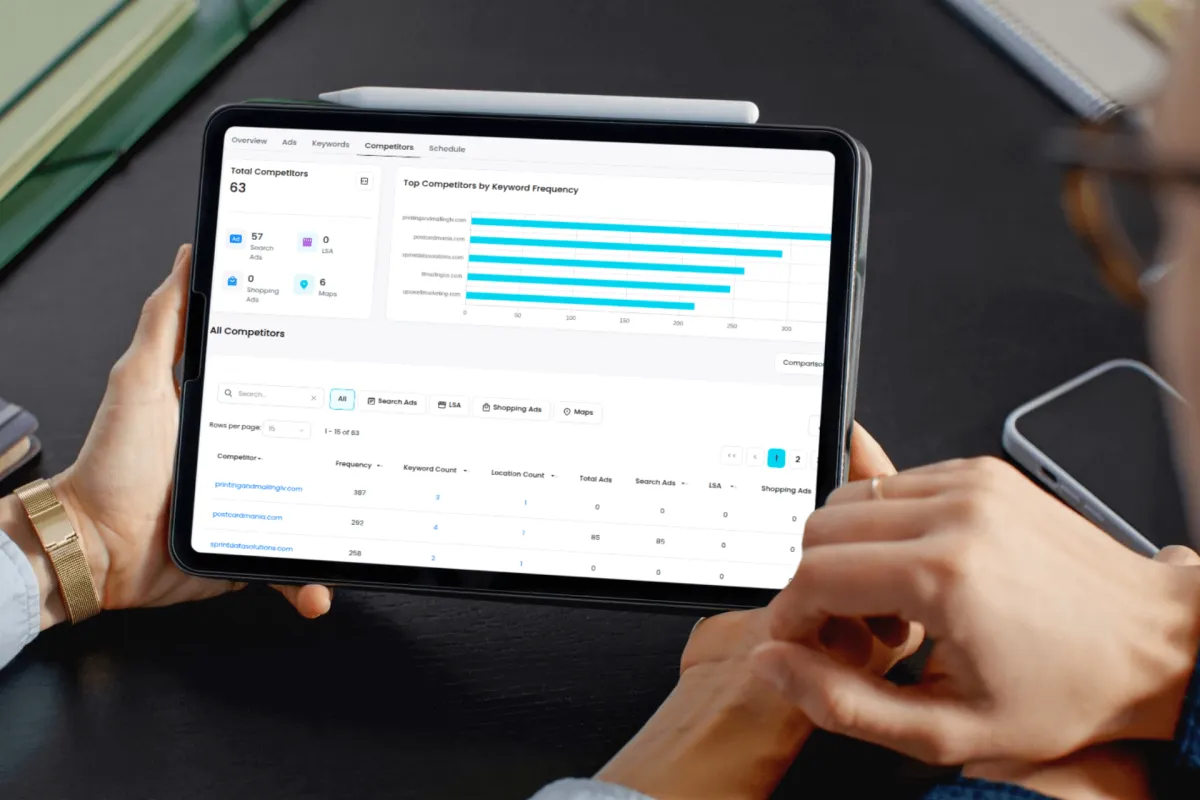
Who is actively advertising in your area
The businesses competing for attention in the same local searches.How crowded high-intent searches actually are
Where competition concentrates around booking or purchase-ready terms.When pressure increases and eases
How advertiser activity changes by day and time.Which advertisers are consistently present — and which are not
Patterns that explain why things feel stable one week and volatile the next.
This isn’t analysis.
It’s visibility.
Orientation: What This Is (And Isn't)
Before you look at the data, it helps to be clear about what you’re looking at.
This report shows market behavior, not account performance.
Everything comes from live advertising and search results data.
It reflects what’s happening publicly — not inside any one business.
It doesn’t tell you what to change.
It doesn’t rank you.
It doesn’t score you.
It shows context.
From the Broad View to Your City
Market behavior looks different when you zoom in.
Your local report uses the same market lens, narrowed to a single city.
Instead of industry-wide patterns, you’ll see:
Which advertisers are active in your city
The businesses competing for attention in the same local searches as you.Local keyword pressure
How competitive core and high-intent searches are in your specific market.City-specific demand patterns
Where and when local search demand concentrates over time.
This report doesn’t change the data.
It changes the scope — from industry-wide to right in your backyard.

How Report Delivery Works
City-level market reports are generated on request.
Once submitted:
Initial access is delivered within approximately 24 hours
This includes your city-specific market view and baseline data.The report continues updates hourly
As additional data flows in, the picture becomes more complete over the following days.
This approach reflects actual market behavior — not a static snapshot.
What This Report Is Not 🛑
This report is not an audit.
It is not an account review.
It does not provide personalized advice.
And it is not a sales pitch.
There’s no analysis of your campaigns.
No recommendations.
No expectation that you take action.
This report doesn’t tell you what to change.
It shows you what you’re up against.
City-level reports are generated on request and begin populating immediately.
© 2026 • Local Market Signals by 30Logic • All Rights Reserved • Privacy Policy